- Visualization
- Computer Science
Achievement: Constructing fiber surfaces is a popular technique for multivariate data visualization that generalizes the idea of level-set visualization for univariate data to multivariate data. The limitation of the fiber surface visualization algorithm is that it assumes input data have no uncertainty, which is rarely the case for real-world experimental or simulation data. Uncertainty is inherent to experimental and simulation data and is subject to multiple factors, including limited accuracy of sensors, numerical approximations, and errors in simulation parameters. In this study, we have developed probabilistic version of the fiber surface reconstruction algorithm that can convey the uncertainty in input bivariate data through visualizations. Through our experiments, we demonstrate how the uncertainty propagation through the fiber surface reconstruction algorithm remarkably enhances feature recovery based on probabilistic algorithmic decisions and provides insight into stable and unstable features present within data. We successfully utilized OCLF ORNL GPU computing resources for efficient uncertainty analysis, which addressed the computational overhead caused by our proposed probabilistic models.
Significance and Impact: Our proposed fiber visualization algorithm is an important scientific innovation to understanding uncertainty underlying bivariate simulation data generated across wide range of DOE application domains, including chemistry and oceanology. The proposed uncertainty visualization framework for bivariate data will act as a building block for uncertainty analysis of more intricate multivariate data with more than two variables. The uncertainty analysis using our methods and approach will help scientists improve trust in scientific visualizations and gauge reliability of scientific discoveries. Moreover, the GPU implementation of our approach will ensure minimal impact of uncertainty quantification on performance of time-critical scientific applications.
Research Details
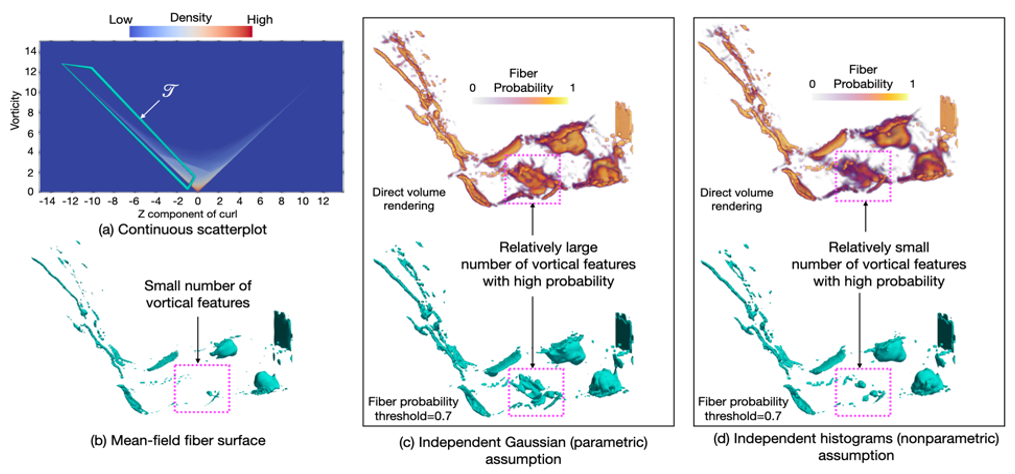
- The uncertainty in input data is modeled with parametric (e.g., uniform and Gaussian) and nonparametric (e.g., histograms and kernel density estimation) probability distributions. The probability distributions are estimated by analyzing ensemble members or local variations within a simulation.
- The positional probability of fibers is quantified per cell of a uniform grid by understanding the interaction of fiber surface reconstruction steps with statistical models of data uncertainty.
- Probability computations per cell are performed independently of other grid cells, and such independence is leveraged to accelerate probability computations with NVIDIA V100 GPU at OLCF ORNL.
- Low- and high-probability fiber features are communicated with users via direct volume rendering of probabilities derived for fibers and extracting level sets based on probability thresholds.
Facility: Visualization Group and Oak Ridge Leadership Computing Facility at ORNL.
Sponsor/Funding: Scientific Discovery Through Advanced Computing program in the U.S. Department of Energy (DOE SciDAC), Intel Graphics and Visualization Institutes of XeLLENCE, the Intel OneAPI CoE, National Institutes of Health (NIH), and Utah Office of Energy Development
PI and affiliation: David Pugmire, Visualization Group, Computer Science and Mathematics Division, ORNL,
Chris R. Johnson, Distinguished Professor, SCI Institute, University of Utah
Team: Tushar M. Athawale (ORNL), Chris R. Johnson (SCI Institute, University of Utah), Sudhanshu Sane (Luminary Cloud), David Pugmire (ORNL)
Citation and DOI: Tushar M. Athawale, Chris R. Johnson, Sudhanshu Sane, and David Pugmire, Fiber Uncertainty Visualization of Bivariate Data with Parametric and Nonparametric Noise Models. To appear in IEEE Transactions on Visualization and Computer Graphics, Special Issue on IEEE VIS 2022. [pdf] [Acceptance rate: 122/460 = 26.5%]; DOI: 10.1109/TVCG.2022.3209424
Summary: Visualization and analysis of multivariate data and their uncertainty are top research challenges in data visualization. Constructing fiber surfaces is a popular technique for multivariate data visualization that generalizes the idea of level-set visualization for univariate data to multivariate data. In this paper, we present a statistical framework to quantify positional probabilities of fibers extracted from uncertain bivariate fields. Specifically, we extend the state-of-the-art Gaussian models of uncertainty for bivariate data to other parametric distributions (e.g., uniform and Epanechnikov) and more general nonparametric probability distributions (e.g., histograms and kernel density estimation) and derive corresponding spatial probabilities of fibers. In our proposed framework, we leverage Green's theorem for closed-form computation of fiber probabilities when bivariate data are assumed to have independent parametric and nonparametric noise. Additionally, we present a nonparametric approach combined with numerical integration to study the positional probability of fibers when bivariate data are assumed to have correlated noise. For uncertainty analysis, we visualize the derived probability volumes for fibers via volume rendering and extracting level sets based on probability thresholds. We present the utility of our proposed techniques via experiments on synthetic and simulation datasets.