Project Details
Motivation
Roadways are critical to meeting the mobility and economic needs of the nation. The United States uses 28% of its energy in moving goods and people, with approximately 60% of that utilized by cars, light trucks, and motorcycles. Thus, improved transportation efficiency is vital to America’s economic progress. The increasing congestion and energy resource requirements of transportation systems for metropolitan areas require research in methods to improve and optimize control methods. Coordinating and optimizing traffic in urban areas may introduce hundreds of thousands of vehicles and traffic management systems, which can require high performance computing (HPC) resources to model and manage.
This data set was created to understand the potential for machine learning, computer vision, and HPC to improve the energy efficiency aspects of traffic control by leveraging GRIDSMART traffic cameras as sensors for adaptive traffic control, with a sensitivity to the fuel consumption characteristics of the traffic in the camera’s visual field. GRIDSMART cameras—an existing, fielded commercial product—sense the presence of vehicles at intersections and replace more conventional sensors (such as inductive loops) to issue calls to traffic control. These cameras, which have horizon-to-horizon view, offer the potential for an improved view of the traffic environment which can be used to generate better control algorithms.
Collection Methodology
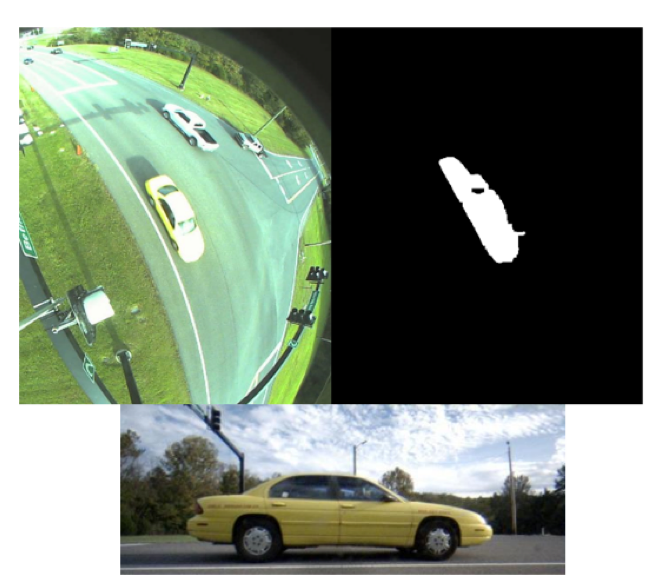
A ground-based sensor (GBS) system with a conventional camera captured a relatively high resolution image of the vehicle of interest near a GRIDSMART instrumented intersection. Simultaneously, the same vehicle is captured from the GRIDSMART overhead view. The GBS image was classified by some method including a commercial application, a vehicle matching algorithm, and manual review to create a vehicle label for the overhead GRIDSMART-captured images. The data was captured at ORNL at the Melton Valley Drive intersection.
The GBS images are registered with respect to the wheels of the vehicle of interest. The GRIDSMART image was segmented using computer-vision-based tools that emulated (albeit simplified) the GRIDSMART processing. We used the MATLAB computer vision toolkit [MathWorks, 2019a], with a mixture of Gaussian model to separate potential vehicles from the background. The implementation used the MATLAB computer vision ForegroundDetector [MathWorks, 2019b] with parameters set to 25 learning frames, a learning rate of 0.005, a minimum background ratio of 0.7, automatic initial variance, and a Gaussian cardinality of 3. Foreground detection was followed by a sequence of screening and post-processing, including an image dilation and an estimate of the vehicle location based on an observed trajectory map for the location. The trajectory map was created for the Melton Valley intersection and included vehicles proceeding left-right on the image, vehicles proceeding right-left, and vehicles entering left and turning to the right.
Additional data hygiene performed included the selection of the vehicle of interest to match the ground image to the overhead image. The highest resolution frame (or near highest resolution frame) was saved for each entry.
In addition to GBS-based collections, there were a number of unique vehicle types that passed through the intersection that we also identified through a segmentation process. These included larger vehicles that were not identified in the GBS sensor; we relied on our original segmentation process to identify these, given that they could be screened initially by the size of their bounding box and including “18-wheelers”, large multi-axle trucks, motorcycles and bicycles, and busses. We termed this segmentation process the “Wild non-GBS” data (WGBS). We were also able to identify vehicles that were used routinely at ORNL, including passenger utility vehicles such as the Chevrolet Express minibus and delivery vans. These vehicles typically lacked a year/make/model but were included for their utility.
In the resultant data set, a total of 6,695 vehicles were identified in 685 different vehicle categories. The vehicle distribution is not evenly spread, as roughly 150 classes have a single vehicle and some have as many as 238. The median number in each category is only 4.
Note that we make no claims about how this distribution truly reflects the “vehicle demographics” at ORNL, as we focused on detections from the GBS and our special classes. Another note regarding the data is the uniqueness of each vehicle. We also make no claims that each image is truly an independent vehicle sample; in other words, while the image may be taken at a different day or time, two images of a 2005–2011 Toyota Tacoma may indeed be the SAME VEHICLE. Finally, we also reviewed each image and each GBS-GRIDSMART pair to ensure the classifications seemed correct and that the GBS-GRIDSMART images were the same vehicle. However, we must allow for the possible errors in the data collection and screening process, and we are hopeful that any errors found by researchers will be shared for future corrections.
The distribution features an intersection view, the vehicle segmentation mask, and the ground image collected from the GBS. For some vehicles the ground image is omitted.
The fuel consumption characteristics were obtained from fueleconomy.gov and from the alternate fuels data center web site (afdc.energy.gov). Note that vehicles variants that involved unconventional fuels were omitted by inspecting the value of the “atvType” field from fuelecomony.gov. The omitted fuel types were Bifuel (CNG), Bifuel (LPG), CNG, and EV.
This work was funded by the Department of Energy Vehicle Technologies Office (VTO) as a HPC4Mobility seedling project.
If you use this data set please reference the paper “Estimating Vehicle Fuel Economy from Overhead Camera Imagery and Application for Traffic Control” by Karnowski et al as well as this web page https://www.ornl.gov/project/ornl-overhead-vehicle-dataset-oovd.
Access Data
| Variable Name | Description |
|---|---|
| Class | Vehicle class, either from automated identification methods with human verification or from the WGBS entries. |
| IntersectionFile | The name of the image for the intersection view of the vehicle of interest. |
| IntersectionFileSeg | The name of the segmentation file for the intersection view of the vehicle of interest. |
| GroundFile | The name of the ground image captured by the GBS for the vehicle of interest |
| CroppedFile | The name of the “cropped” image, which was obtained by using the bounding box columns from the intersection image. The cropped image was then resized to 127 pixels width and 127 pixels height. |
| BBoxX | The bounding box “X” corner coordinate in the intersection view image. |
| BBoxY | The bounding box “Y” corner coordinate in the intersection view image. |
| BBoxW | The bounding box width in the intersection view image. |
| BBoxL | The bounding box height in the intersection view image. |
| OrientationInDegrees | The orientation of the segmentation image in degrees, where 0 degrees is oriented horizontal (i.e., traverses the image field left to right or right to left) and 90 degrees is oriented vertical (i.e., traverses the image field top to bottom or bottom to top). |
| OrientedLength | The length of the vehicle segmentation mask bounding box after correcting for the orientation. |
| OrientedWidth | The width of the vehicle segmentation mask bounding box after correcting for the orientation. |
| CentroidX | The X coordinate of the centroid of the vehicle bounding box. |
| CentroidY | The Y coordinate of the centroid of the vehicle bounding box. |
| UTCCollectionTime | The collection time of the ground-based image in UTC. When a ground-based image was not available, the time was based on the GRIDSMART time. (These times should be accurate to within +/- 2 seconds or less; the intention is to capture the rough time of day.) |
| NumberOfEntriesInFuelEconomy | Numeric value that indicates the number of vehicle variants that likely fall under this vehicle class (for the non-WGBS classifications). For example, a 4-wheel drive and 2-wheel drive version of the same vehicle would count as two variants. |
| MeanCombMPG | The mean combined MPG value from the fueleconomy.gov [EERE, 2019c] or alternate fuels data center download [EERE, 2019d] across all the variants for a vehicle type |
| STDCombMPG | The mean combined MPG value from the fueleconomy.gov download across all the variants for a vehicle type |
| MaxCombMPG | The maximum value of combined MPG value from the fueleconomy.gov download across all the variants for a vehicle type |
| MinCombMPG | The minimum combined MPG value from the fueleconomy.gov download across all the variants for a vehicle type |
| MedCombMPG | The median combined MPG value from the fueleconomy.gov download across all the variants for a vehicle type |
| NumberOfEntriesWithConventionalFuel | The number of entries using conventional fuel in the fueleconomy.gov download across all the variants for a vehicle type. This number will be less than or equal to the NumberOfEntriesInFuelEconomy column value. |
Acknowledgements
We acknowledge the contributions of the ORNL team, including Matt Eicholtz, Russ Henderson, Johnathan Sewell, Eva Freer, Regina Ferrell, Deniz Aykac, Travis Johnston, Sean Oesch, Thomas Naughton, Wael Elwasif, Steven Young, Robert Patton, Derek Rose, Claus Daniel, Rich Davies, Husain M. Abdul Aziz, and Hong Wang.
References
Argonne National Laboratory. 2019. Energy Systems Division, Reducing Vehicle Idling, https://www.anl.gov/es/reducing-vehicle-idling.
EERE. 2019a. About the Office of Energy Efficiency and Renewable Energy, https://www.energy.gov/eere/about-office-energy-efficiency-and-renewabl…
EERE. 2019b. Energy Efficient Mobility Systems, Vehicle Technologies Office, https://www.energy.gov/eere/vehicles/energy-efficient-mobility-systems
EERE. 2019c. Download Fuel Economy Data, obtained in March 2019; https://www.fueleconomy.gov/feg/download.shtml.
EERE. 2019d. Alternate fuels data center site, https://afdc.energy.gov/data/10310.
MathWorks. 2019a. Computer Vision Toolbox. https://www.mathworks.com/products/computer-vision.html
MathWorks. 2019b.vision.ForegroundDetector, https://www.mathworks.com/help/vision/ref/vision.foregrounddetector-system-object.html
OpenCV. 2019. OpenCV 4.1 is here. https://opencv.org/