Achievement: Clinicians rely on the electrocardiogram (ECG) to rapidly diagnose heart diseases. The noise in ECG measurements can reduce the trustworthiness of diagnosis as well as clinical decisions and can directly affect the patient health. In this paper, we present a framework for quantification of the uncertainty in the source of arrhythmia for noisy ECG measurements. We propose the application of various visualization techniques, such as probability maps, confidence maps, level sets, and topology-based visualizations, to effectively communicate the uncertainty in source localization with clinicians. Our proposed uncertainty visualizations can aid clinicians in enhancing the overall trust in diagnosis and decision-making.
Significance and Impact: Uncertainty quantification is extremely important in the domain of biomedical data analysis and visualization to ensure reliability of clinical decisions, and subsequently reduce patient risk. Our proposed framework can help clinicians gain insight into positional uncertainty of the source of arrhythmia and perform uncertainty-aware decision making. Our proposed techniques would act as building blocks for uncertainty analysis of multiple sources of arrhythmia and different arrhythmia scenarios, and ultimately enhance patient safety.
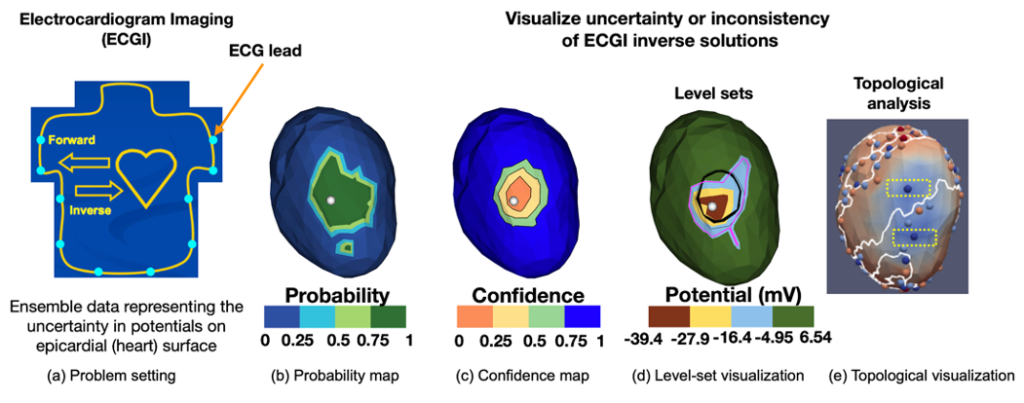
Research Details
- Initially, simulation is performed with a forward model, where heart potentials with a single source of arrhythmia are mapped to torso surface potential using a high-resolution finite element mesh.
- Gaussian noise is added to the torso surface potentials to generate an ensemble representing noisy ECG measurements.
- Noisy ECG measurements are mapped back to heart surface potential using Conjugate-Gradient Least Squares (CGLS) and Preconditioned Conjugate-Gradient Least Squares (PCGLS) methods.
- The aggregate analysis of the ensemble of inverse solutions is performed with probability maps, confidence maps, level sets, and topology-based visualizations to gain insight into the variability of the source position.
Facility: Visualization Group at ORNL.
Sponsor/Funding: Scientific Discovery Through Advanced Computing program in the U.S. Department of Energy (DOE SciDAC), Intel Graphics and Visualization Institutes of XeLLENCE, and National Institutes of Health (NIH)
PI and affiliation: Chris R. Johnson, Distinguished Professor, SCI Institute, University of Utah
Team: Dennis Njeru (SCI Institute, University of Utah), Tushar M. Athawale (ORNL), Jessie France (SCI Institute, University of Utah), Chris R. Johnson (SCI Institute, University of Utah)
Citation and DOI: Dennis Njeru, Tushar M. Athawale, Jessie France, and Chris R. Johnson, Quantifying and Visualizing Uncertainty for Source Localization in Electrocardiographic Imaging, To Appear in Computer Methods in Biomechanics and Biomedical Engineering: Imaging & Visualization, 2022. [pdf] DOI: 10.1080/21681163.2022.2113824
Summary: Electrocardiographic imaging (ECGI) presents a clinical opportunity to noninvasively understand the sources of arrhythmias for individual patients. To help increase the effectiveness of ECGI, we provide new ways to visualize associated measurement and modeling errors. In this paper, we study source localization uncertainty in two steps: First, we perform Monte Carlo simulations of a simple inverse ECGI source localization model with error sampling to understand the variations in ECGI solutions. Second, we present multiple visualization techniques, including confidence maps, level-sets, and topology-based visualizations, to better understand uncertainty in source localization. Our approach offers a new way to study uncertainty in the ECGI pipeline.