Rainy-day weather maps on any news channel or website spatially show the distribution of clouds and rain across the region. Environmental researchers need to distinguish particular gases and map their distributions in a manner similar to such a map.
To learn the extent of gas distributions and identify the concentrations of particular chemistries within the gas, researchers at ORNL have merged a pair of existing tools—hyperspectral infrared (IR) transmission spectroscopy and computed tomography (CT).
A collaborative team from the Energy and Transportation Science Division (Panos Datskos and Marissa Morales), Electrical and Electronics Systems Research Division (Philip Bingham), and Biosciences Division (David Graham) is combining two mature imaging technologies in a new way to monitor atmospheric gases over large areas. The team’s Laboratory Directed Research and Development project uses IR transmission spectroscopy measurement in conjunction with CT methods to perform spatially distributed measurements of greenhouse gases such as methane (CH4) and carbon dioxide (CO2).
“The idea is to be able to monitor specific gases over large areas and know how much you have in each location,” Datskos said. “One of the challenges is having the right equipment. Using tunable quantum cascade lasers, we can get spectra in the right wavelength region.”
Bingham explained that the IR laser is scanned over an area and through various wavelengths. Using a set laser-scanning pattern allows for tomographic reconstruction methods to determine the spectral response at various points over the scanned area. The chemical concentrations then can be determined at each reconstructed location.
Infrared spectroscopy uses laser wavelengths of different colors to develop a gas’s signature, whereas tomography makes images of a variety of views using a large number of rays. The tomographic images can be thought of as slices of the cloud.
Many views are required to reconstruct a plume of gas. The ORNL team developed CT reconstruction algorithms and built an IR-CT laboratory prototype to study a CH4 plume using 16 projection angles and 11 mirrors. The prototype enabled them to perform CT reconstruction of the shape of a gas plume in the lab environment.
“Every chemical has a fingerprint. You can tell methane because of its absorption peaks at specific wavelengths,” Datskos said, noting that results from these studies enable researchers to differentiate among multiple chemicals present in a single location, such as those in auto emissions or explosives. “We can see them because of their different spectral signature.”
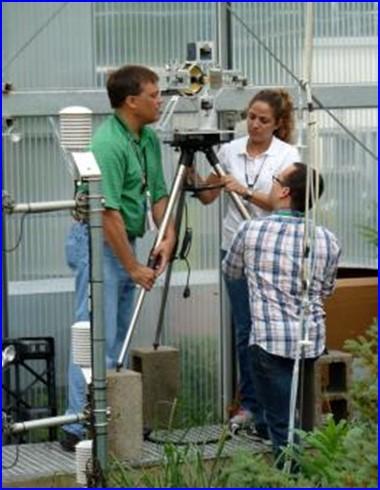
The team also has performed outdoor testing with the IR spectroscopy system at two sites on the ORNL campus. Measurements of methane were performed over fresh water ponds and in the Spruce and Peatland Responses Under Climatic Environmental Change (SPRUCE) demonstration site. These two efforts in the field have proved the ability to distinguish methane peaks with the quantum cascade laser-based hyperspectral IR spectroscopy system over measurement path lengths up to 200 feet. Next steps for this effort are to drive the measurement systems’ sensitivity lower and develop methods for collection of projections needed for CT outdoors over large areas.

