Filter News
Area of Research
- (-) Climate and Environmental Systems (2)
- Advanced Manufacturing (4)
- Building Technologies (1)
- Clean Energy (37)
- Computational Engineering (1)
- Computer Science (6)
- Fusion Energy (4)
- Materials (26)
- National Security (2)
- Neutron Science (9)
- Nuclear Science and Technology (7)
- Quantum information Science (2)
- Renewable Energy (1)
- Supercomputing (9)
- Transportation Systems (1)
News Type
News Topics
Media Contacts

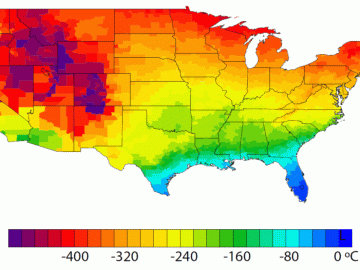
A detailed study by Oak Ridge National Laboratory estimated how much more—or less—energy United States residents might consume by 2050 relative to predicted shifts in seasonal weather patterns

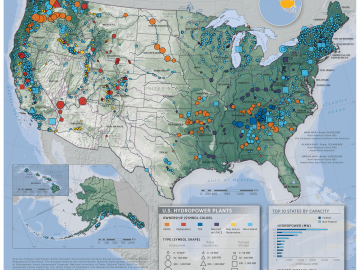
Oak Ridge National Laboratory researchers have produced the next generation of the National Hydropower Map – a visualization tool that provides updated statistics on overall capacity and performance on the nation’s hydropower fleet. The map is part of the lab’s National Hydropower ...


