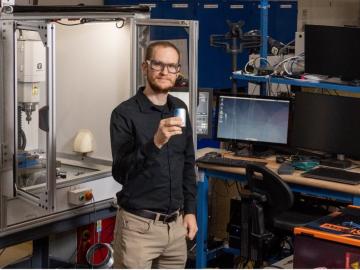
Updated software improves slicing for large-format 3D printing

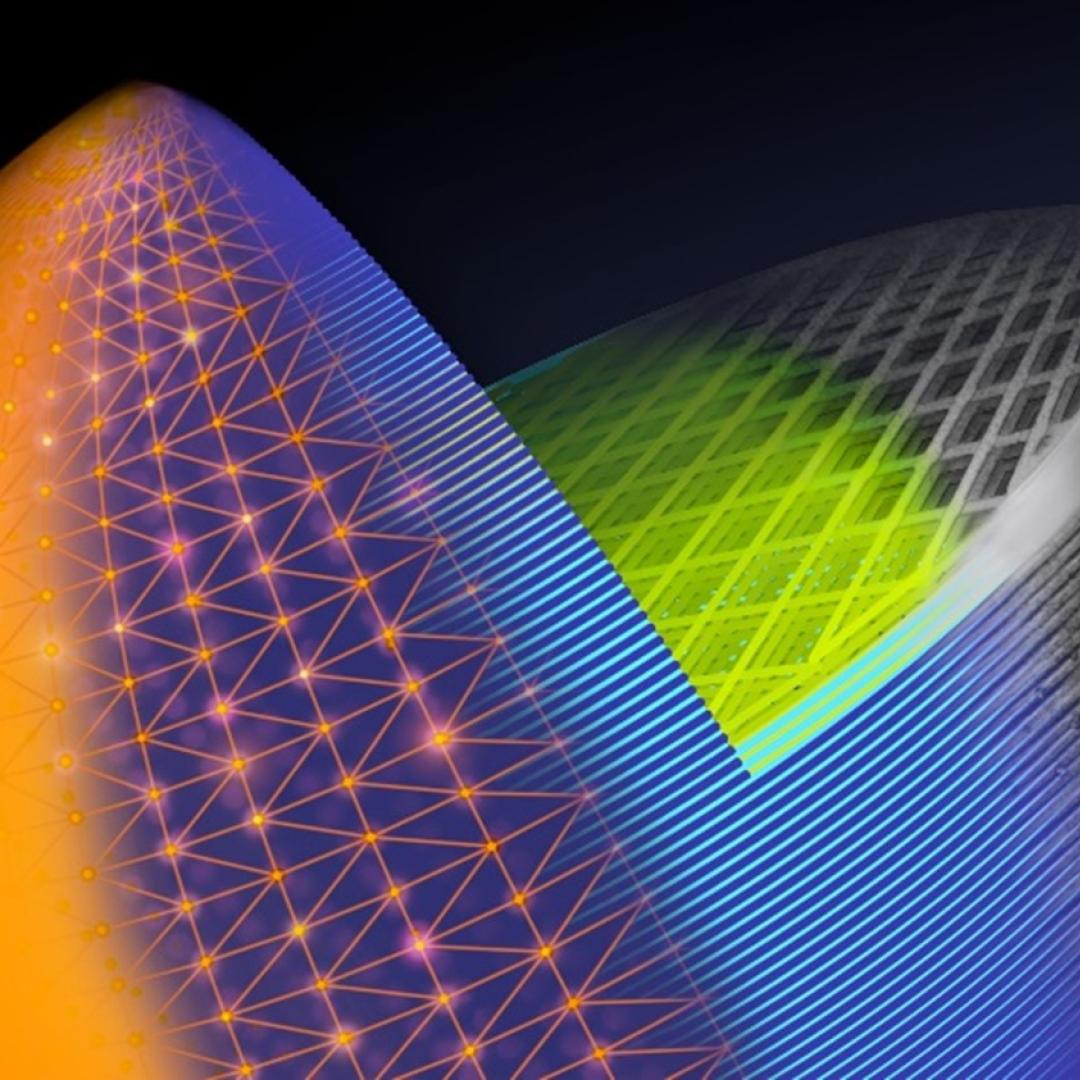
Wildfires have shaped the environment for millennia, but they are increasing in frequency, range and intensity in response to a hotter climate. The phenomenon is being incorporated into high-resolution simulations of the Earth’s climate by scientists at the Department of Energy’s Oak Ridge National Laboratory, with a mission to better understand and predict environmental change.
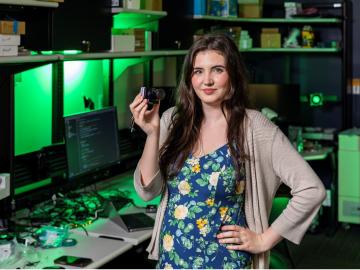
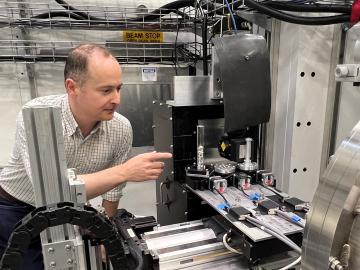
Tristen Mullins enjoys the hidden side of computers. As a signals processing engineer for ORNL, she tries to uncover information hidden in components used on the nation’s power grid — information that may be susceptible to cyberattacks.
Inspired by one of the mysteries of human perception, an ORNL researcher invented a new way to hide sensitive electric grid information from cyberattack: within a constantly changing color palette.
How did we get from stardust to where we are today? That’s the question NASA scientist Andrew Needham has pondered his entire career.
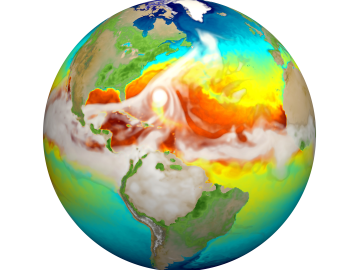
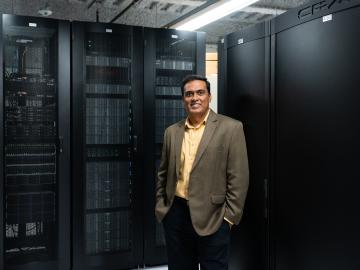
The Earth System Grid Federation, a multi-agency initiative that gathers and distributes data for top-tier projections of the Earth’s climate, is preparing a series of upgrades.
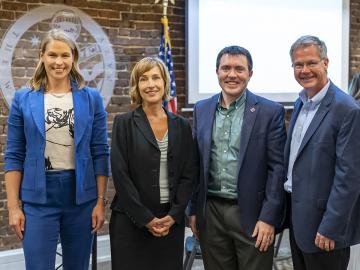
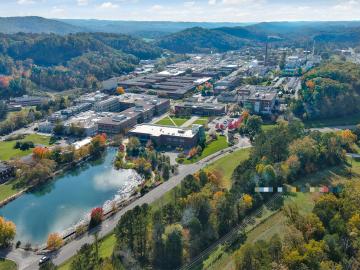
A crowd of investors and supporters turned out for last week’s Innovation Crossroads Showcase at the Knoxville Chamber as part of Innov865 Week. Sponsored by ORNL and the Tennessee Advanced Energy Business Council, the event celebrated deep-tech entrepreneurs and the Oak Ridge Corridor as a growing energy innovation hub for the nation.
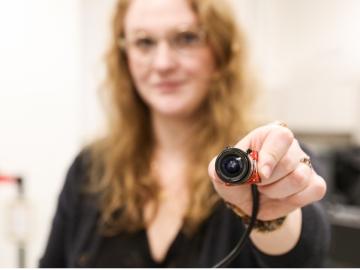
Though Nell Barber wasn’t sure what her future held after graduating with a bachelor’s degree in psychology, she now uses her interest in human behavior to design systems that leverage machine learning algorithms to identify faces in a crowd.
The Atmospheric Radiation Measurement Data Center is shepherding changes to its operations to make the treasure trove of data more easily available accessible and useful to scientists studying Earth’s climate.
How an Alvin M. Weinberg Fellow is increasing security for critical infrastructure components
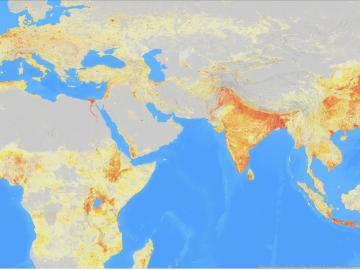
It’s a simple premise: To truly improve the health, safety, and security of human beings, you must first understand where those individuals are.