![Sphere that has the top right fourth removed (exposed) Colors from left are orange, dark blue with orange dots, light blue with horizontal lines, then black. Inside the exposure is green and black with boxes.](/sites/default/files/styles/featured_square_large/public/2024-06/slicer.jpg?h=56311bf6&itok=bCZz09pJ)
Filter News
Area of Research
- (-) Clean Energy (45)
- (-) National Security (9)
- Advanced Manufacturing (5)
- Biology and Environment (13)
- Building Technologies (1)
- Climate and Environmental Systems (1)
- Computational Engineering (2)
- Computer Science (12)
- Electricity and Smart Grid (2)
- Functional Materials for Energy (1)
- Fusion and Fission (9)
- Fusion Energy (6)
- Isotopes (1)
- Materials (30)
- Materials for Computing (8)
- Mathematics (1)
- Neutron Science (8)
- Nuclear Science and Technology (6)
- Quantum information Science (4)
- Sensors and Controls (1)
- Supercomputing (27)
News Type
News Topics
- (-) Composites (11)
- (-) Computer Science (14)
- (-) Coronavirus (5)
- (-) Cybersecurity (4)
- (-) Fusion (2)
- (-) Grid (18)
- (-) Molten Salt (1)
- (-) Nanotechnology (5)
- 3-D Printing/Advanced Manufacturing (35)
- Advanced Reactors (3)
- Artificial Intelligence (4)
- Big Data (5)
- Bioenergy (6)
- Biology (5)
- Biomedical (2)
- Biotechnology (1)
- Buildings (16)
- Chemical Sciences (6)
- Clean Water (4)
- Climate Change (9)
- Critical Materials (5)
- Decarbonization (6)
- Energy Storage (32)
- Environment (24)
- Frontier (1)
- High-Performance Computing (3)
- Hydropower (2)
- Isotopes (1)
- Machine Learning (4)
- Materials (20)
- Materials Science (16)
- Mathematics (1)
- Mercury (1)
- Microscopy (4)
- National Security (4)
- Net Zero (1)
- Neutron Science (4)
- Nuclear Energy (4)
- Partnerships (2)
- Physics (2)
- Polymers (7)
- Security (2)
- Simulation (2)
- Space Exploration (2)
- Statistics (1)
- Summit (1)
- Sustainable Energy (34)
- Transformational Challenge Reactor (1)
- Transportation (33)
Media Contacts
![A new computational approach by ORNL can more quickly scan large-scale satellite images, such as these of Puerto Rico, for more accurate mapping of complex infrastructure like buildings. Credit: Maxar Technologies and Dalton Lunga/Oak Ridge National Laboratory, U.S. Dept. of Energy](/sites/default/files/styles/list_page_thumbnail/public/2020-02/Puerto_Rico_Resflow9.png?h=a0a1befd&itok=5n2fss_e)
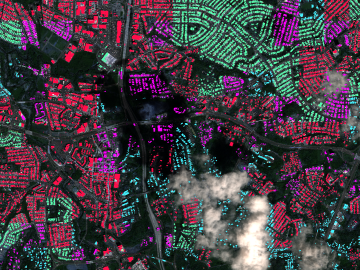
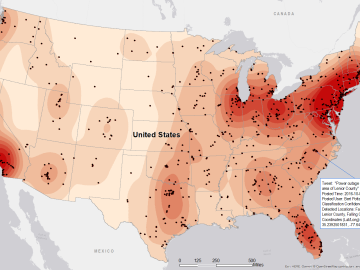
A novel approach developed by scientists at ORNL can scan massive datasets of large-scale satellite images to more accurately map infrastructure – such as buildings and roads – in hours versus days.
![Smart Neighborhood homes](/sites/default/files/styles/list_page_thumbnail/public/2020-01/04.09.TD-SMartHome_0.jpg?h=5b5a5437&itok=22S5Tle1)
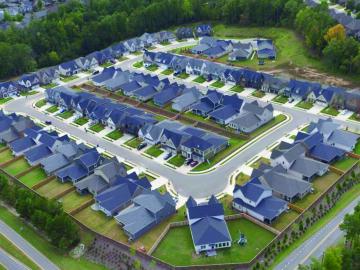
To better determine the potential energy cost savings among connected homes, researchers at Oak Ridge National Laboratory developed a computer simulation to more accurately compare energy use on similar weather days.
![CellSight allows for rapid mass spectrometry of individual cells. Credit: John Cahill, Oak Ridge National Laboratory/U.S. Dept of Energy](/sites/default/files/styles/list_page_thumbnail/public/2019-10/4CellSightPhoto_0.png?h=67debf3e&itok=fmsxiN_b)
Researchers at the Department of Energy’s Oak Ridge National Laboratory have received five 2019 R&D 100 Awards, increasing the lab’s total to 221 since the award’s inception in 1963.
![Layering on the strength](/sites/default/files/styles/list_page_thumbnail/public/2019-09/Z-pinning-printed%20wall_ORNL-2_0.png?h=c8a62123&itok=EnqQdQih)
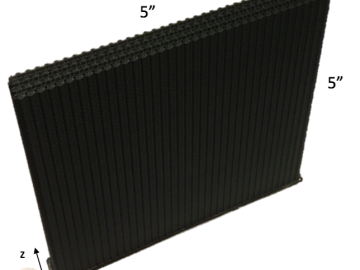
A team including Oak Ridge National Laboratory and University of Tennessee researchers demonstrated a novel 3D printing approach called Z-pinning that can increase the material’s strength and toughness by more than three and a half times compared to conventional additive manufacturing processes.
![Heat impact map](/sites/default/files/styles/list_page_thumbnail/public/2019-07/Winter_HDD_Change_ORNL.gif?h=e87b941e&itok=8t83D_u_)
A detailed study by Oak Ridge National Laboratory estimated how much more—or less—energy United States residents might consume by 2050 relative to predicted shifts in seasonal weather patterns
![Desalination process](/sites/default/files/styles/list_page_thumbnail/public/2019-07/hydrophopicDesal04_0.jpg?h=5473d993&itok=bUBkpGOa)
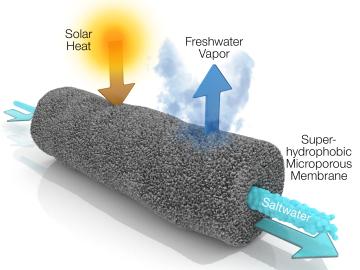
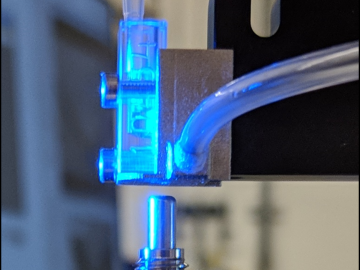
A new method developed at Oak Ridge National Laboratory improves the energy efficiency of a desalination process known as solar-thermal evaporation.
![Low-cost, compact, printed sensor that can collect and transmit data on electrical appliances for better load monitoring](/sites/default/files/styles/list_page_thumbnail/public/2019-03/2019-P01301_0.jpg?h=c6980913&itok=y0S4bq0p)
Scientists at Oak Ridge National Laboratory have developed a low-cost, printed, flexible sensor that can wrap around power cables to precisely monitor electrical loads from household appliances to support grid operations.
![As part of a preliminary study, ORNL scientists used critical location data collected from Twitter to map the location of certain power outages across the United States.](/sites/default/files/styles/list_page_thumbnail/public/2019-02/PowerOutageTweets_map_0.png?h=6448fdc1&itok=AUit-O2Y)
Gleaning valuable data from social platforms such as Twitter—particularly to map out critical location information during emergencies— has become more effective and efficient thanks to Oak Ridge National Laboratory.
![Laminations such as these are compiled to form the core of modern electric vehicle motors. ORNL has developed a software toolkit to speed the development of new motor designs and to improve the accuracy of their real-world performance.](/sites/default/files/styles/list_page_thumbnail/public/2019-02/Motors_OeRSTED_0.jpg?h=af53702d&itok=mT24R4WI)
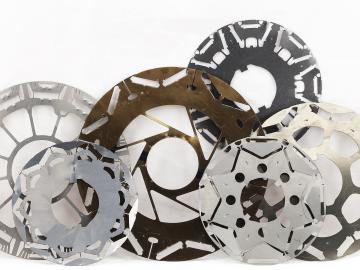
Oak Ridge National Laboratory scientists have created open source software that scales up analysis of motor designs to run on the fastest computers available, including those accessible to outside users at the Oak Ridge Leadership Computing Facility.
![Researchers used machine learning methods on the ORNL Compute and Data Environment for Science, or CADES, to map vegetation communities in the Kougarok Watershed on the Seward Peninsula of Alaska. The colors denote different types of vegetation, such as w Researchers used machine learning methods on the ORNL Compute and Data Environment for Science, or CADES, to map vegetation communities in the Kougarok Watershed on the Seward Peninsula of Alaska. The colors denote different types of vegetation, such as w](/sites/default/files/styles/list_page_thumbnail/public/rs2019_highlight_plot_3d.png?itok=5bROV_ys)
A team of scientists led by Oak Ridge National Laboratory used machine learning methods to generate a high-resolution map of vegetation growing in the remote reaches of the Alaskan tundra.