


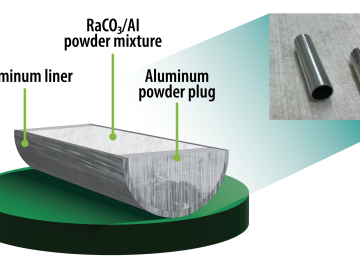
Oak Ridge National Laboratory researchers have developed a method to simplify one step of radioisotope production — and it’s faster and safer.
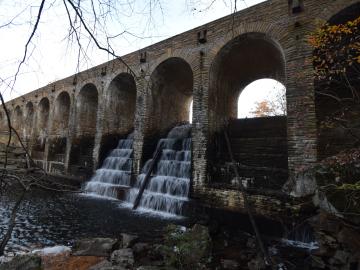
Although more than 92,000 dams populate the country, the vast majority — about 89,000 — do not generate electricity through hydropower.
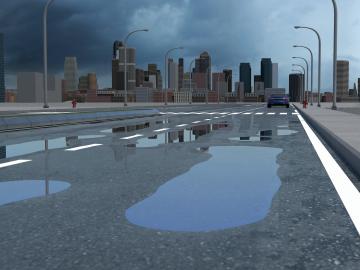
Researchers at Oak Ridge National Laboratory have identified a statistical relationship between the growth of cities and the spread of paved surfaces like roads and sidewalks. These impervious surfaces impede the flow of water into the ground, affecting the water cycle and, by extension, the climate.
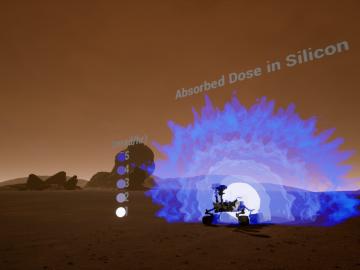
Researchers at Oak Ridge National Laboratory are developing a first-of-a-kind toolkit drawing on video game development software to visualize radiation data.
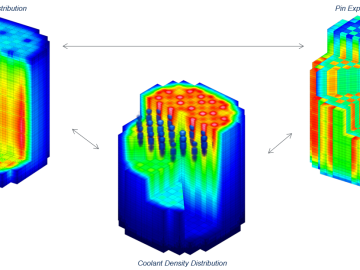
Nuclear scientists at Oak Ridge National Laboratory have established a Nuclear Quality Assurance-1 program for a software product designed to simulate today’s commercial nuclear reactors – removing a significant barrier for industry adoption of the technology.

A study led by Oak Ridge National Laboratory explored the interface between the Department of Veterans Affairs’ healthcare data system and the data itself to detect the likelihood of errors and designed an auto-surveillance tool

Oak Ridge National Laboratory researchers have produced the next generation of the National Hydropower Map – a visualization tool that provides updated statistics on overall capacity and performance on the nation’s hydropower fleet. The map is part of the lab’s National Hydropower ...