Artificial intelligence tools secure tomorrow’s electric grid
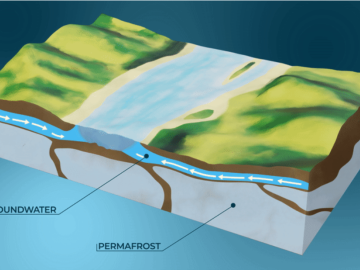
A study by Oak Ridge National Laboratory, the University of Copenhagen, the National Park Service and the U.S. Geological Survey showed that hotter summers and permafrost loss are causing colder water to flow into Arctic streams, which could impact sensitive fish and other wildlife.
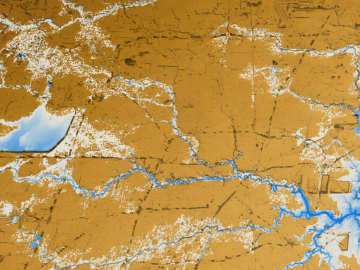
A new tool from Oak Ridge National Laboratory can help planners, emergency responders and scientists visualize how flood waters will spread for any scenario and terrain.
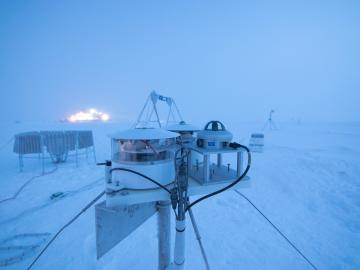
Researchers at Oak Ridge National Laboratory were part of an international team that collected a treasure trove of data measuring precipitation, air particles, cloud patterns and the exchange of energy between the atmosphere and the sea ice.
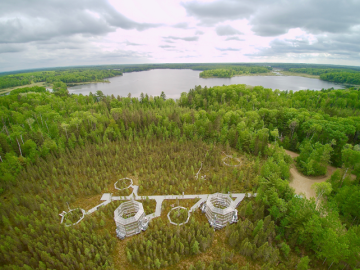
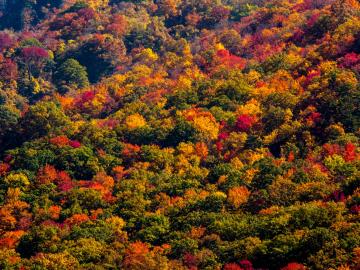
Oak Ridge National Laboratory scientists evaluating northern peatland responses to environmental change recorded extraordinary fine-root growth with increasing temperatures, indicating that this previously hidden belowground mechanism may play an important role in how carbon-rich peatlands respond to warming.
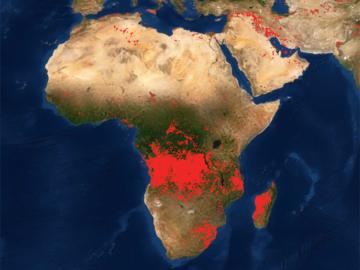
Researchers at Oak Ridge National Laboratory developed a method that uses machine learning to predict seasonal fire risk in Africa, where half of the world’s wildfire-related carbon emissions originate.
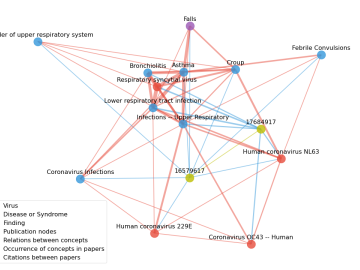
Scientists have tapped the immense power of the Summit supercomputer at Oak Ridge National Laboratory to comb through millions of medical journal articles to identify potential vaccines, drugs and effective measures that could suppress or stop the
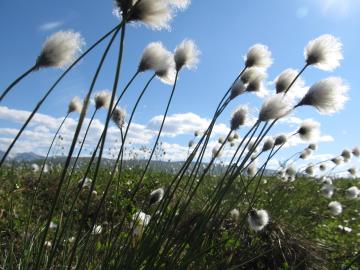
An international team of scientists found that rules governing plant growth hold true even at the edges of the world in the Arctic tundra.
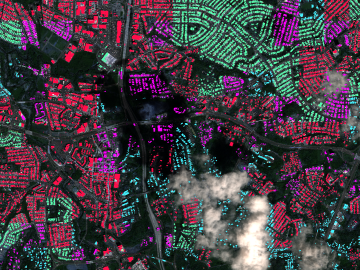
A novel approach developed by scientists at ORNL can scan massive datasets of large-scale satellite images to more accurately map infrastructure – such as buildings and roads – in hours versus days.
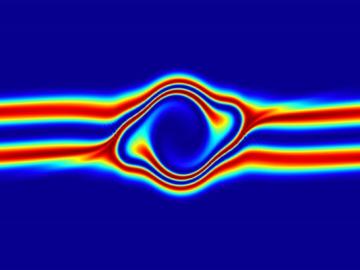
The prospect of simulating a fusion plasma is a step closer to reality thanks to a new computational tool developed by scientists in fusion physics, computer science and mathematics at ORNL.