![Sphere that has the top right fourth removed (exposed) Colors from left are orange, dark blue with orange dots, light blue with horizontal lines, then black. Inside the exposure is green and black with boxes.](/sites/default/files/styles/featured_square_large/public/2024-06/slicer.jpg?h=56311bf6&itok=bCZz09pJ)
Filter News
Area of Research
- (-) Biology and Environment (26)
- (-) Supercomputing (11)
- Advanced Manufacturing (1)
- Biological Systems (1)
- Clean Energy (22)
- Climate and Environmental Systems (3)
- Computational Biology (1)
- Computational Engineering (2)
- Computer Science (5)
- Fusion Energy (1)
- Isotopes (3)
- Materials (11)
- Materials for Computing (2)
- Mathematics (1)
- National Security (3)
- Neutron Science (4)
- Nuclear Science and Technology (3)
- Quantum information Science (1)
News Type
News Topics
- (-) Big Data (5)
- (-) Bioenergy (10)
- (-) Environment (20)
- (-) Machine Learning (2)
- (-) Mercury (1)
- (-) Space Exploration (1)
- (-) Summit (6)
- 3-D Printing/Advanced Manufacturing (2)
- Advanced Reactors (1)
- Artificial Intelligence (2)
- Biology (15)
- Biomedical (5)
- Biotechnology (2)
- Chemical Sciences (1)
- Clean Water (3)
- Climate Change (10)
- Composites (1)
- Computer Science (18)
- Coronavirus (3)
- Critical Materials (3)
- Decarbonization (2)
- Energy Storage (1)
- Exascale Computing (1)
- Frontier (1)
- Fusion (1)
- Grid (2)
- High-Performance Computing (6)
- Hydropower (3)
- Materials (2)
- Materials Science (1)
- Nanotechnology (1)
- Nuclear Energy (1)
- Polymers (2)
- Quantum Computing (4)
- Quantum Science (3)
- Simulation (2)
- Sustainable Energy (10)
- Transportation (2)
Media Contacts
![This simulation of a fusion plasma calculation result shows the interaction of two counter-streaming beams of super-heated gas. Credit: David L. Green/Oak Ridge National Laboratory, U.S. Dept. of Energy](/sites/default/files/styles/list_page_thumbnail/public/2020-02/Fusion_plasma_simulation.jpg?h=d0852d1e&itok=CDWgjLPL)
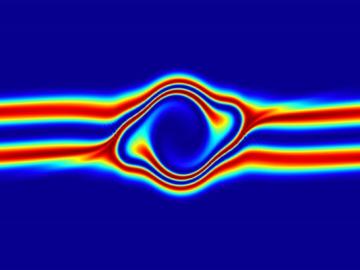
The prospect of simulating a fusion plasma is a step closer to reality thanks to a new computational tool developed by scientists in fusion physics, computer science and mathematics at ORNL.
![Project bridges compute staff, resources at ORNL and VA health data to speed suicide risk screening for US veterans. Image Credit: Carlos Jones, ORNL](/sites/default/files/styles/list_page_thumbnail/public/2019-08/VA_REACHVET1%5B6%5D_0.jpg?h=173ee000&itok=-eA5t15j)
In collaboration with the Department of Veterans Affairs, a team at Oak Ridge National Laboratory has expanded a VA-developed predictive computing model to identify veterans at risk of suicide and sped it up to run 300 times faster, a gain that could profoundly affect the VA’s ability to reach susceptible veterans quickly.
![Galactic wind simulation](/sites/default/files/styles/list_page_thumbnail/public/2019-07/Robertson%5B2%5D.png?h=319b3f54&itok=jK6lUXEt)
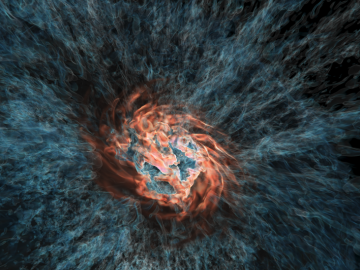
Using the Titan supercomputer at Oak Ridge National Laboratory, a team of astrophysicists created a set of galactic wind simulations of the highest resolution ever performed. The simulations will allow researchers to gather and interpret more accurate, detailed data that elucidates how galactic winds affect the formation and evolution of galaxies.
![Virtual universes](/sites/default/files/styles/list_page_thumbnail/public/2019-04/Virtual_universes_0.jpg?h=91594b4a&itok=dhv4iPBH)
Using Summit, the world’s most powerful supercomputer housed at Oak Ridge National Laboratory, a team led by Argonne National Laboratory ran three of the largest cosmological simulations known to date.
![Small modular reactor computer simulation](/sites/default/files/styles/list_page_thumbnail/public/2019-04/Nuclear_simulation_scale-up.jpg?h=5992a83f&itok=A0oscIPL)
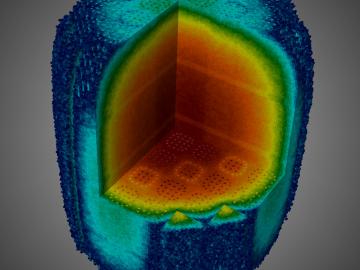
In a step toward advancing small modular nuclear reactor designs, scientists at Oak Ridge National Laboratory have run reactor simulations on ORNL supercomputer Summit with greater-than-expected computational efficiency.
![Researchers used machine learning methods on the ORNL Compute and Data Environment for Science, or CADES, to map vegetation communities in the Kougarok Watershed on the Seward Peninsula of Alaska. The colors denote different types of vegetation, such as w Researchers used machine learning methods on the ORNL Compute and Data Environment for Science, or CADES, to map vegetation communities in the Kougarok Watershed on the Seward Peninsula of Alaska. The colors denote different types of vegetation, such as w](/sites/default/files/styles/list_page_thumbnail/public/rs2019_highlight_plot_3d.png?itok=5bROV_ys)
A team of scientists led by Oak Ridge National Laboratory used machine learning methods to generate a high-resolution map of vegetation growing in the remote reaches of the Alaskan tundra.